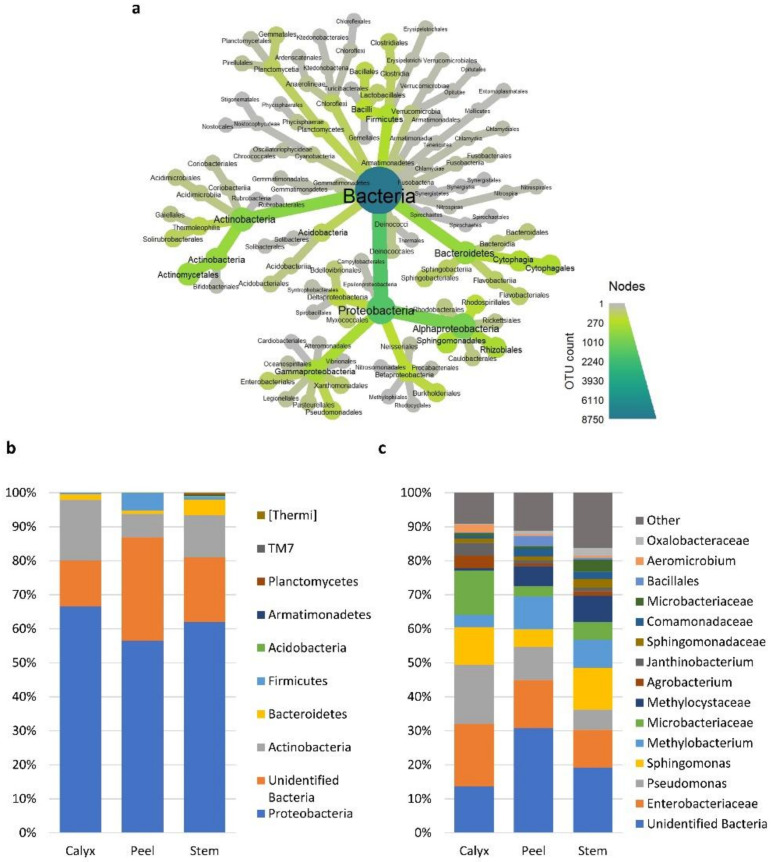
Figure 4.
Relative abundances of the most prevalent bacterial taxa >1%. (a) a heat tree showing the overall taxonomic hierarchy from phyla to order level. The size and color of nodes and edges are correlated with taxa abundance across all the investigated samples. (b) bar plot showing the distribution of the bacterial phyla among apple tissue types (calyx-end, peel, and stem-end tissues), and (c) at the lowest identifiable taxonomical level. Taxa with relative abundance less than 1% were merged into “Other” group in grey.

