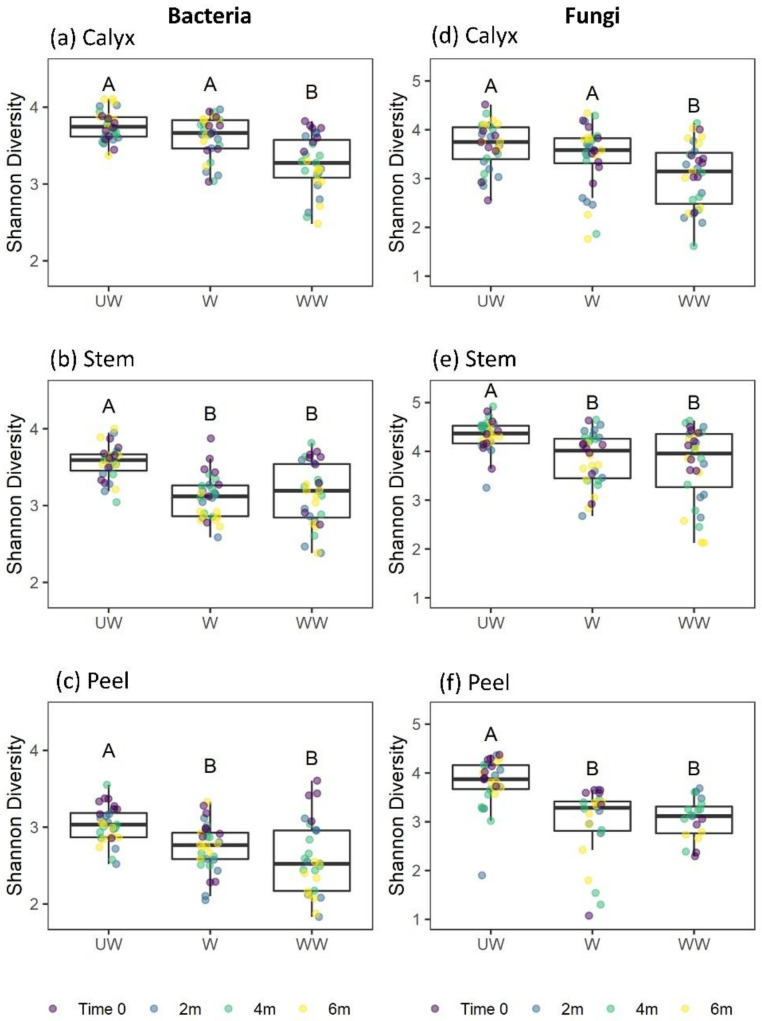
Figure 6.
Box plots showing the bacterial and fungal diversity (Shannon index) in the apple calyx-end (a,d), stem-end (b,e), and peel (c,f) tissues. Superimposed on the box plots are the horizontally jittered raw data points colored according to the sampling points (0, 2 m, 4 m, and 6 m). Different letters indicate significant differences between groups (p < 0.05).

