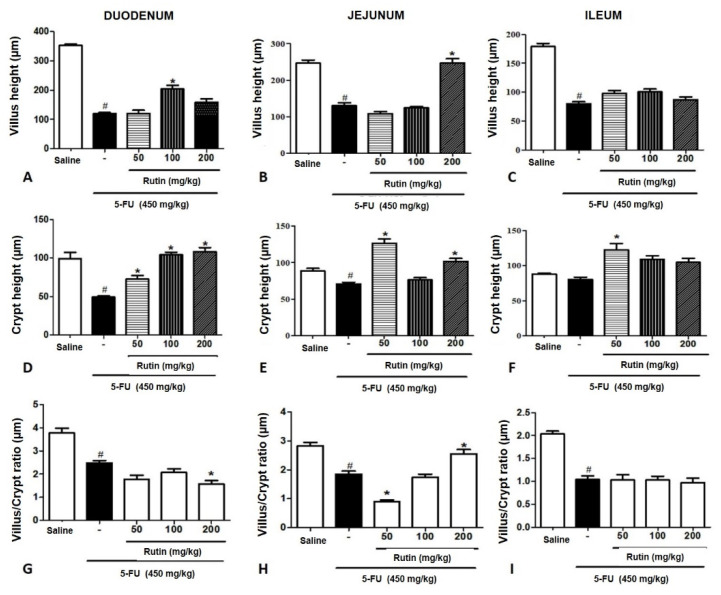
Figure 5.
Morphometric analyses of the mice intestinal segments following 5-FU-induced intestinal mucositis. Experimental groups: Saline, 5-FU, RUT-50, RUT-100, and RUT 200 mg/kg. (A–C): Villi height in the duodenal, jejunal, and ileal segments, respectively. (D–F): Crypt depth of the duodenal, jejunal, and ileal segments, respectively. (G–I): Villus/crypt ratio of the duodenal, jejunal, and ileal segments, respectively. Values are expressed as mean ± SEM. Statistical analysis was performed using the one-way analysis of variance, followed by Tukey’s test. # p < 0.05 vs. saline group and * p < 0.05 vs. group 5-FU. Villus height (µm), Crypt height (µm), Villus/Crypt ratio (µm). 5-FU, 5-fluorouracil; RUT, rutin.

