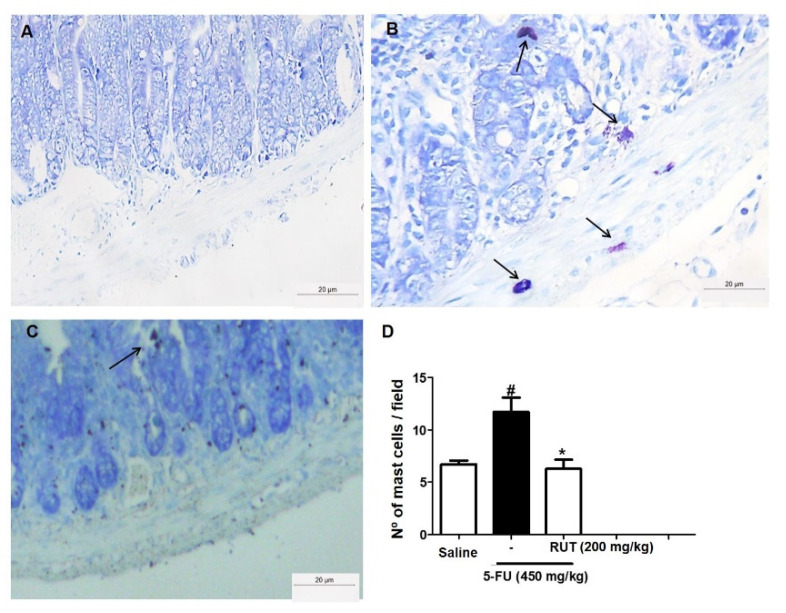
Figure 9.
Mast cell counts in the jejunal segment based on Toluidine Blue staining. Saline (A); 5-FU (B); RUT-200 (C); Statistical representation of experimental groups (D). Black arrows indicate mast cells. All the panels were obtained at 400× magnification. Values are presented as mean ± SEM of the number of mast cells per field. For the statistical analysis, one-way ANOVA was used, followed by Tukey’s test. # p < 0.05 in 5-FU vs. Saline group; * p < 0.05 in RUT-200 vs. 5-FU group. 5-FU, 5-fluorouracil; RUT, rutin.

