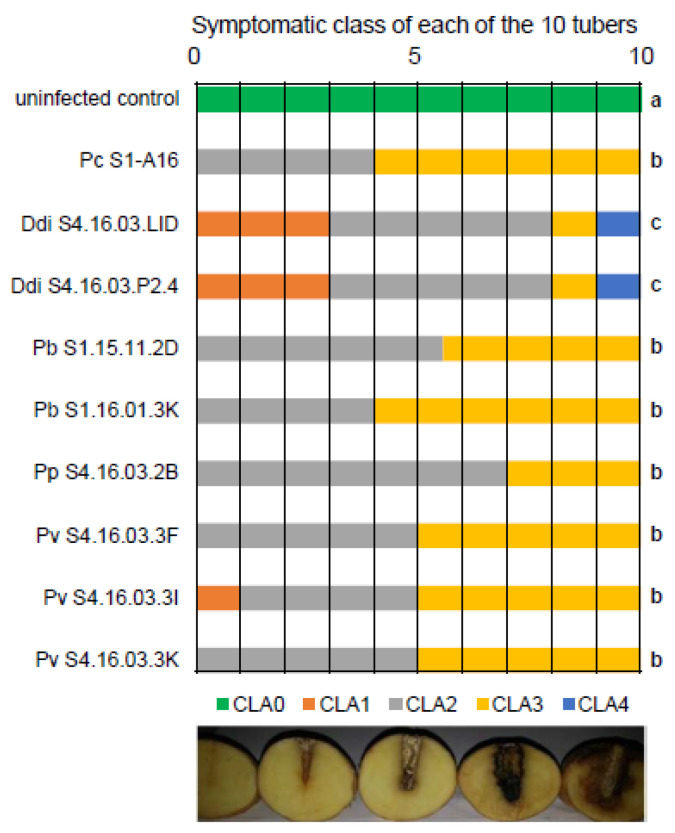
Figure 3.
Virulence test of Pectobacterium and Dickeya on potato tubers. The symptoms provoked by each strain were compared by infecting 10 tubers per strain. The 10 non-inoculated tubers were used as control. Symptoms were classified into five classes (CLA0, CLA1, CLA2, CLA3, CLA4, according to increasing severity). The typology of these classes was illustrated by a picture of an example. Data were statistically analyzed by a Kruskal–Wallis test (α = 5%). Lower case letters on the right of the graph indicate statistical differences between the different inoculated pathogens.

