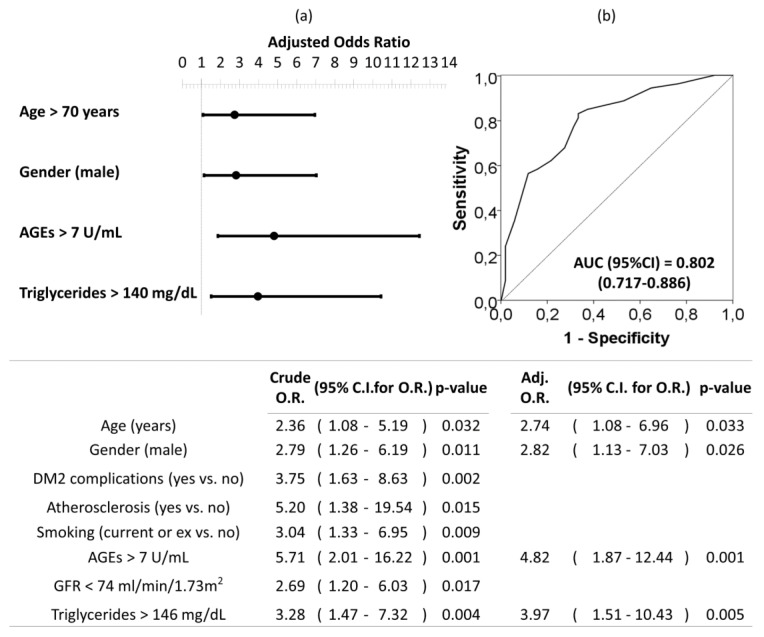
Figure 4.
Forest plot (a) and ROC curve (b) of the multivariate logistic regression of risk factors associated to moderate–severe AAC in patients with DM2. Multivariate analysis was performed using stepwise backward method. Crude and adjusted odds ratio (OR) are indicated in the table. Comparison of the expected and observed frequencies by the Hosmer–Lemeshow goodness-of-fit test (p-value = 0.734) and by ROC curve (AUC = 0.802; p < 0.001) indicated a good fit for the model. AUC = the area under the curve, GFR = glomerular filtration rate.

