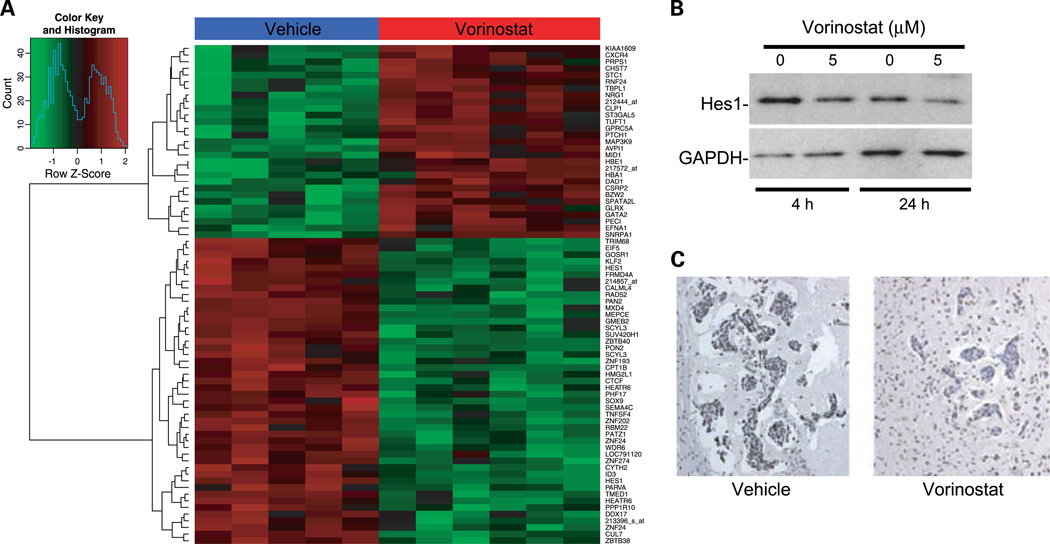
Fig. 5.
Analysis of gene expression changes induced by vorinostat treatment. A, a simple hierarchical clustering of the top 75 genes differentially expressed in the tumor cells of vorinostat-treated mice compared with vehicle controls. Tumor cells were laser capture microdissected from frozen tissue sections. RNA was extracted, amplified, labeled, and applied to Affymetrix Human U133A 2.0 GeneChips. Vorinostat-treated samples are labeled in red and vehicle samples are labeled in blue. B, Western blot validation of decreased Hes1 protein in response to vorinostat treatment. 231-BR cells were treated with 5 μmol/L vorinostat or vehicle for the times indicated. C, immunohistochemical validation of decreased Rad52 protein in vivo. Representative clusters of metastases from vorinostat- and vehicle-treated mice. Magnification, ×200. One section from each of five mice per group was analyzed.

