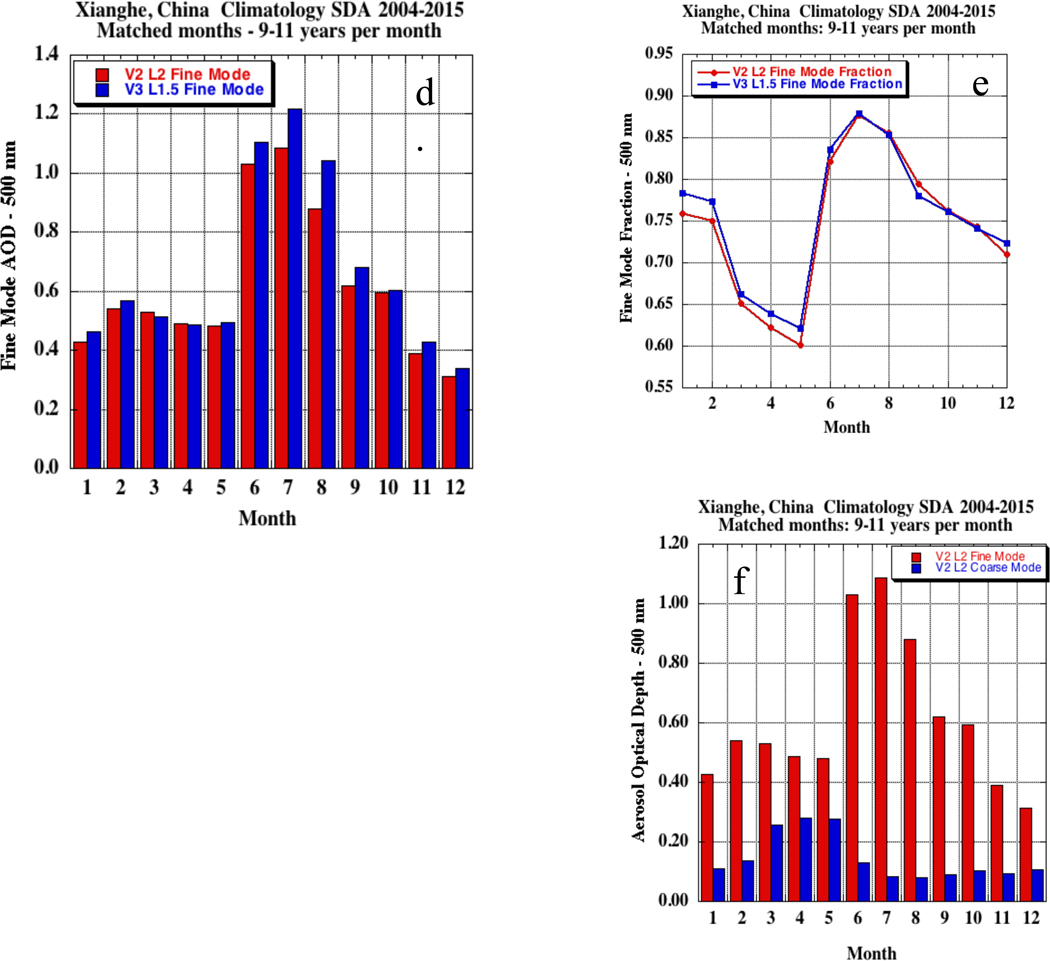
Figure 13.
(d.) Multi-year monthly mean fine mode AOD (500 nm) from SDA, comparing cloud-screened (L2) data from Version 2 to the newer Version 3 for the Xianghe site in China. (e.) Monthly means of the fine mode fraction of AOD (500 nm) comparing results from Version 2 to Version 3. (f.) Multi-year monthly mean fine mode and coarse mode AOD (500 nm) from SDA, from Version 2 cloud-screened (L2) data for the Xianghe site in China.

