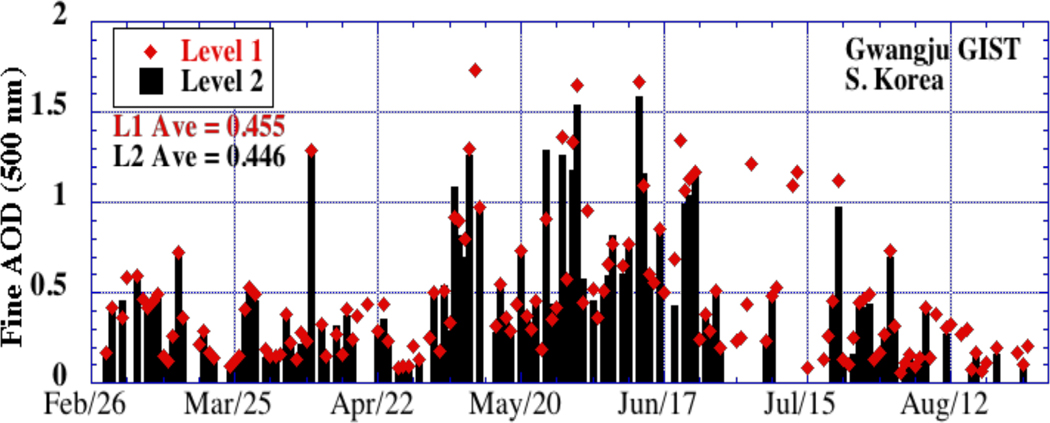
Figure 2.
Similar to Figure 1, the time series of daily averages of fine mode AOD at 500 nm (Version 2) retrieved from SDA for the AERONET site at Gwangju GIST, S. Korea. Note that cloud screening at times removes both high and low AOD days (see before and after July 15, for example), resulting in a similar time series average.

