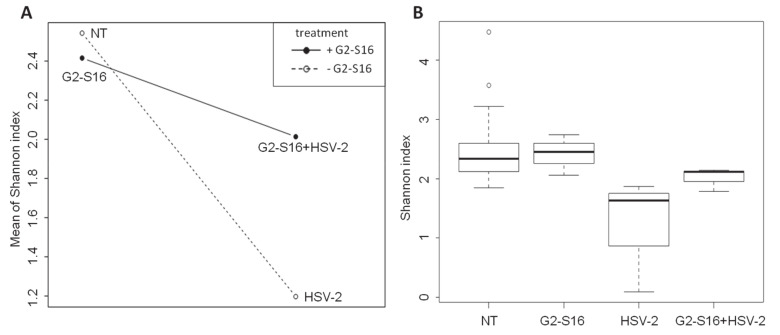
Figure 6.
Comparison of vaginal microbiome diversity within groups of studied mice. Diversity is expressed based on the Shannon Index. (A) Interaction plot showing the Shannon index mean relation between groups using as independent factor HSV-2- infected group (group HSV-2) and treated mice with G2-S16 dendrimer and with HSV-2 (group G2-S16+HSV-2). (B) Boxplot representing Shannon index means for different groups and the maximum and minimum values showing data distribution within groups.

