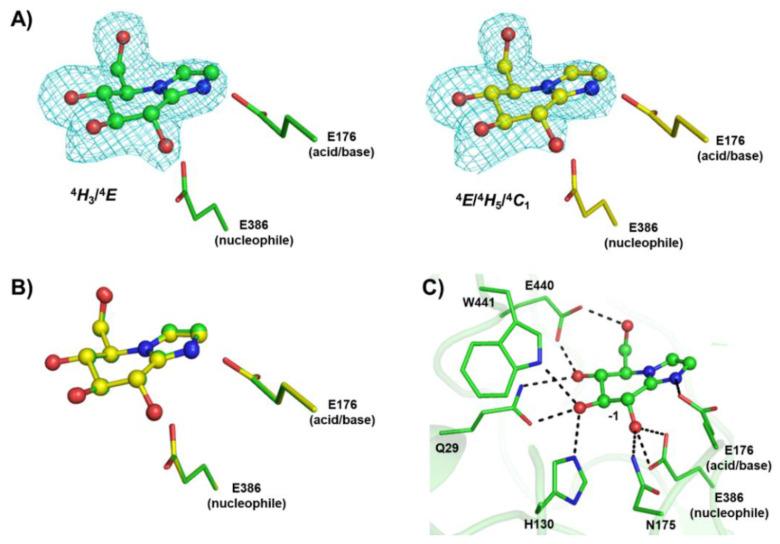
Figure 2.
Structures of rice Os3BGlu7 in complex with glucoimidazole (GIm). (A) The Fo−Fc electron density omit maps of GIm are represented as a cyan mesh contoured at 3σ for molecules A (green) and B (yellow), (B) the superimposition of GIm in molecules A and B, and (C) hydrogen bonds between GIm and Os3BGlu7 at the −1 subsite are shown in black dashed lines.

