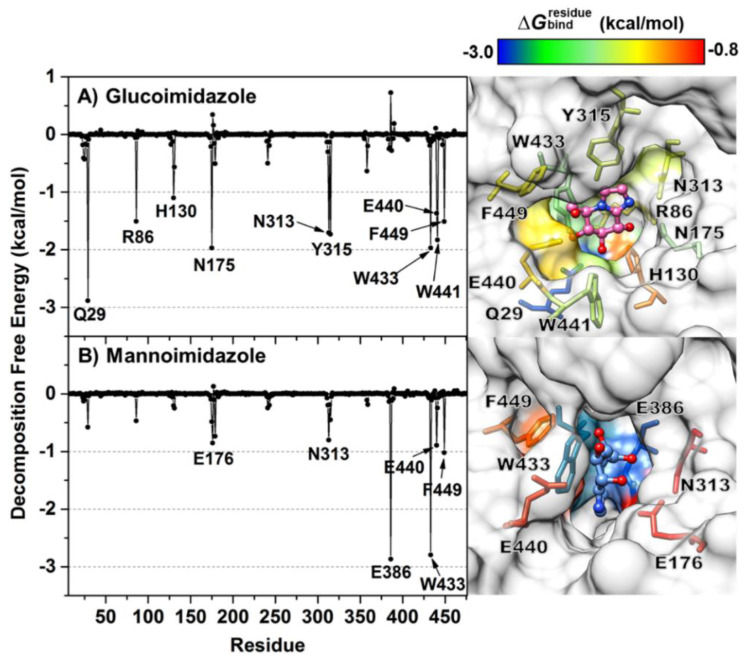
Figure 5.
Per-residue decomposition free energy (kcal/mol) calculated with the MM/GBSA method for Os3BGlu7 in complex with (A) glucoimidazole and (B) mannoimidazole, where only residues involved in inhibitor binding (energy stabilization of <−0.8 kcal/mol) are colored on the basis of their values in the active site structures on the right. The residues with energy contribution ranging from −3.0 to −0.8 kcal/mol are shaded from blue to red, respectively. Note that the binding orientations of both complexes are drawn from the last MD snapshot of each system.

