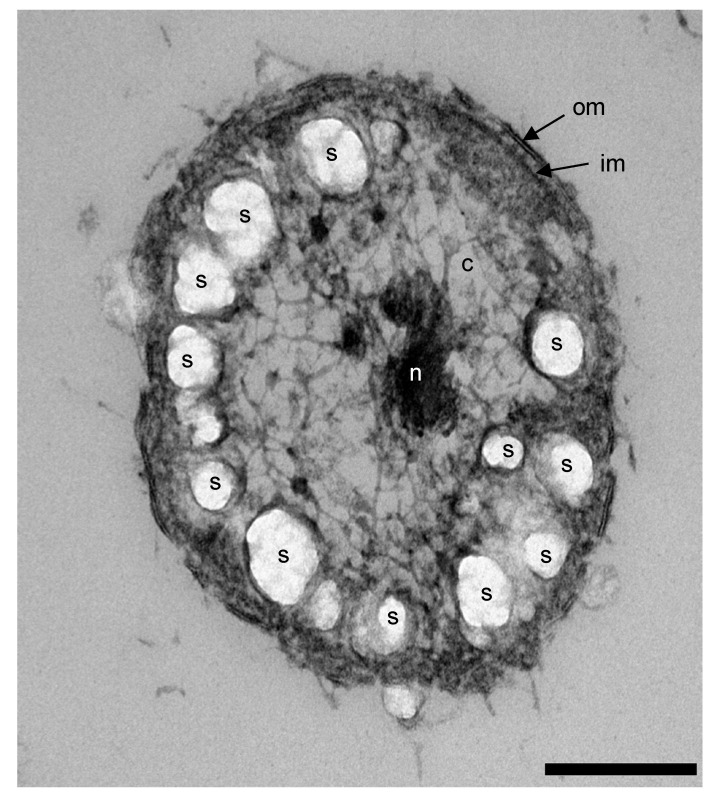
Figure 4.
Transmission electron micrograph of a positively stained thin section of a P. desulfatans F1T cell in late exponential phase, grown with glucose as the substrate. The scale bar corresponds to 200 nm. Arrows mark the outer membrane (om) and inner membrane (im). Further indicated are cytoplasm (c), nucleoid (n) and storage polymer granules (s).

