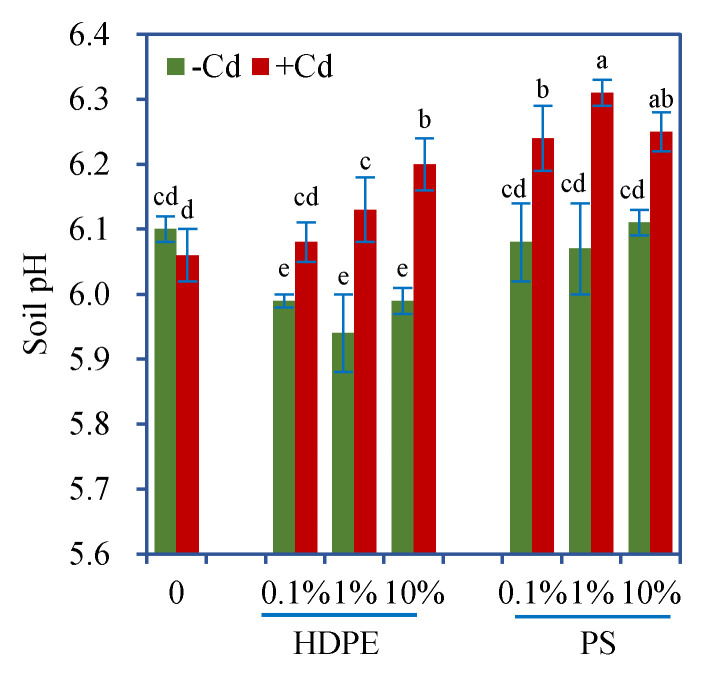
Figure 2.
pH (mean ± SE, n = 4) of soil exposed to MPs with or without Cd. +Cd and -Cd represent the treatments with or without 5 mg/kg Cd, respectively. Different letters over the bars indicate significant differences using a one-way ANOVA followed by Duncan’s multiple range test (p < 0.05). Two-way and three-way ANOVA results are shown in Table 2 and Table 3, respectively.

