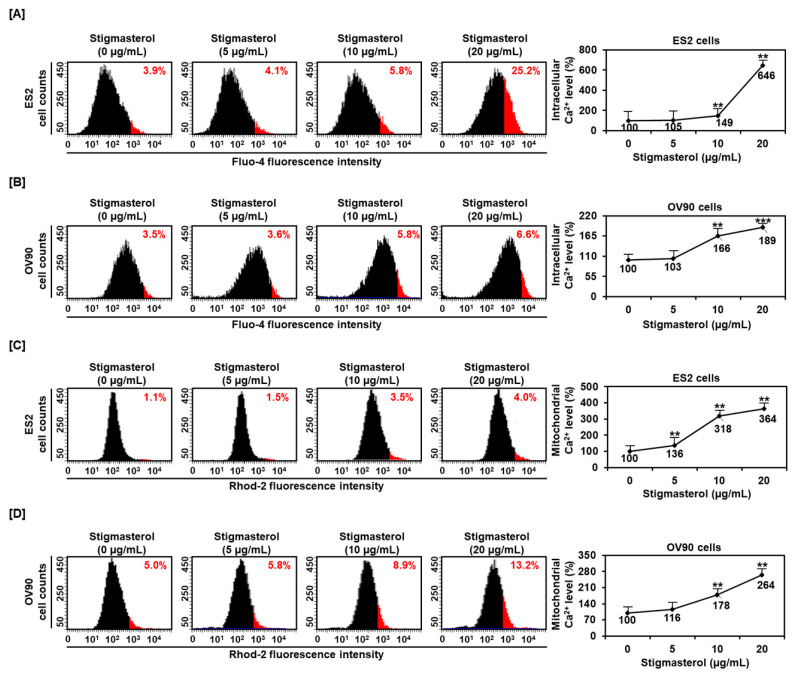
Figure 3.
Calcium concentrations in the cytosol and mitochondria in stigmasterol-treated ovarian cancer cells. (A,B) Fluo-4 dye was used to determine the intracellular calcium levels. The histogram represents the change of cytosolic calcium levels following stigmasterol treatments (0, 5, 10, and 20 μg/mL) in ES2 (Figure 3A, left) and OV90 (Figure 3B, left) cells. The comparative graph represents changes in intracellular calcium levels following stigmasterol treatments compared to the vehicle-treated controls (100%) in ES2 (Figure 3A, right) and OV90 (Figure 3B, right) cells. (C,D) Rhod-2 fluorescence was used to determine the mitochondrial calcium levels in stigmasterol-treated ovarian cancer cells. The histogram represents changes in mitochondrial calcium levels following stigmasterol treatments (0, 5, 10, and 20 μg/mL) in ES2 (Figure 3C, left) and OV90 (Figure 3D, left) cells. The comparative graph represents changes in mitochondrial calcium levels following stigmasterol treatments compared to the vehicle-treated control (100%) in ES2 (Figure 3C, right) and OV90 (Figure 3D, right) cells.

