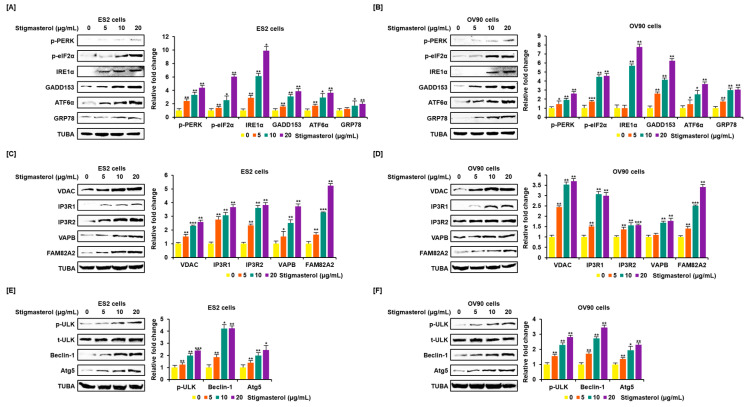
Figure 4.
Increased expression of endoplasmic reticulum (ER) stress sensor proteins and ER-mitochondrial axis proteins due to stigmasterol treatment in ovarian cancer cells. (A,B) Immunoblots representing the expression of unfolded protein response (UPR) proteins following stigmasterol treatments (0, 5, 10, and 20 μg/mL). TUBA was used as a control and is shown at the bottom of the figure. (C,D) Immunoblots representing the expression of ER-mitochondrial axis proteins following stigmasterol treatments (0, 5, 10, and 20 μg/mL). TUBA was used as a control and is shown at the bottom of the figure. (E,F) Immunoblots representing the expression of autophagy proteins following stigmasterol treatment. TUBA was used as a control and is shown at the bottom of the figure.

