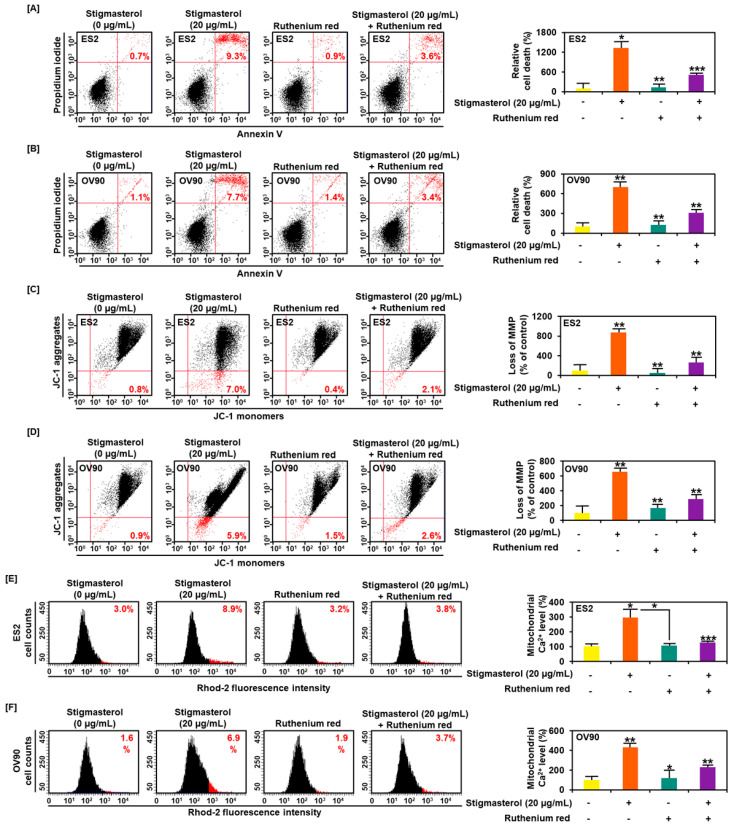
Figure 7.
Calcium regulation and cell apoptosis by stigmasterol in ovarian cancer. (A,B) Annexin V and PI were observed to investigate the cell death of ES2 and OV90 cells. Quadrant of the dot blot represented the state of cell apoptosis in ES2 and OV90 cells. Comparative graph represented the change of late apoptosis by stigmasterol or a combination with ruthenium red compared to the control (100%) in ES2 and OV90 cells. (C,D) JC-1 dye was used to investigate the alteration of the mitochondrial membrane potential by stigmasterol or a combination with ruthenium red. Quadrant of the dot blot represented the state of the mitochondrial membrane potential. Comparative graph represented the loss of the mitochondrial membrane potential compared to the control group (100%). (E,F) Rhod-2 fluorescence was observed to investigate the mitochondrial calcium levels in stigmasterol or a combination with ruthenium red. The histogram represented a change of the mitochondrial calcium. Comparative graph represented the change of the mitochondrial calcium levels.

