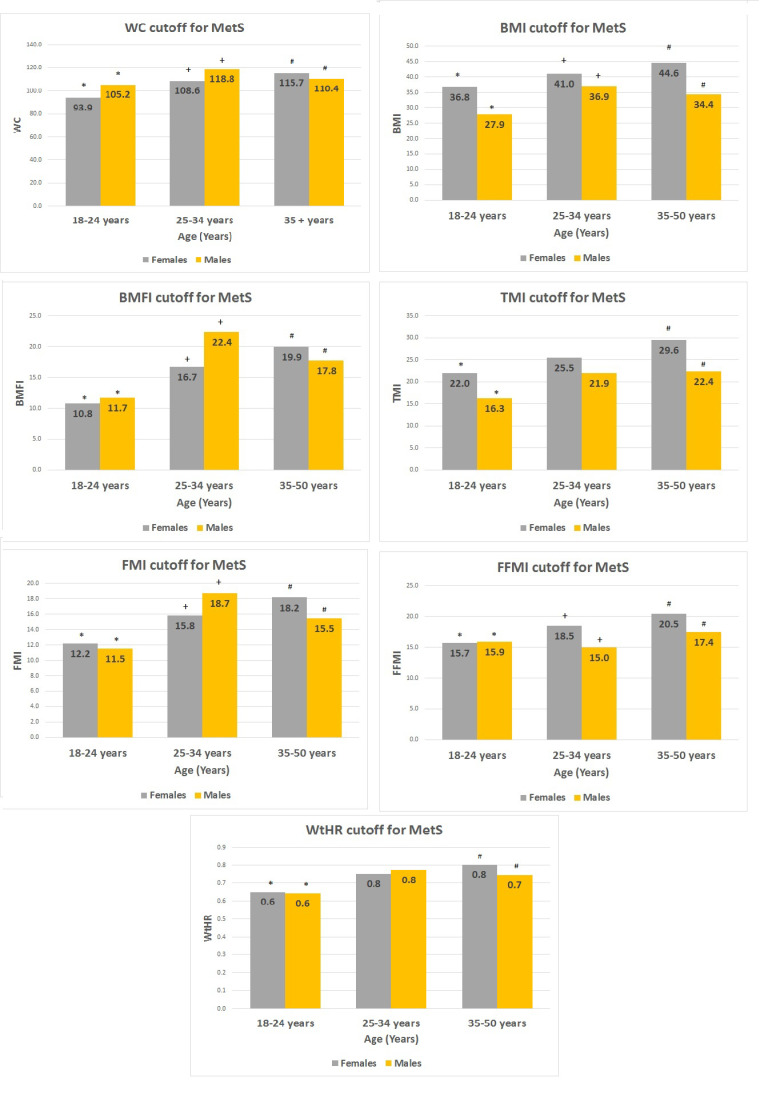
Figure 2.
The threshold values of each index, beyond which MetS is identified, subdivided for sex and three different age groups. Within the columns, at the top, the exact threshold value is reported. * for the difference (p < 0.05) between 18–24 years and 25–34 years; + for the difference (p < 0.05) between 25–34 years and 35–50 years; # for the difference (p < 0.05) between 18–24 years and 35–50 years.

