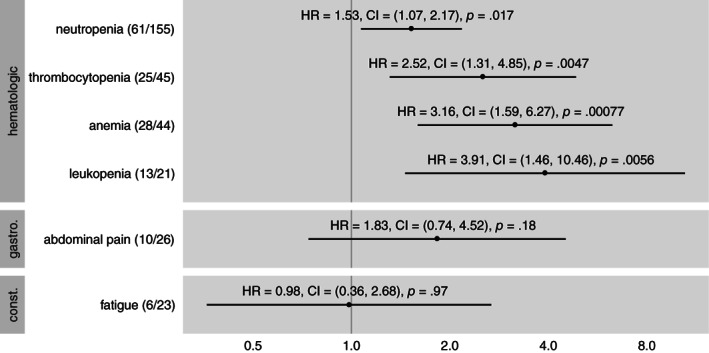
Figure 2.

Hazard ratio of antibacterial exposure for the development of specific adverse events of grade 3 or greater, grouped by category. Dot indicates point estimate of hazard ratio and line indicates 95% confidence interval. In parentheses after the adverse event name, numerator is the number of occurrences of the adverse event during antibacterial exposure and denominator is the number of occurrences of the adverse event overall. p values from t test. All adverse events are derived from the adverse events recorded by the investigators, not by lab values. Abbreviations: CI, confidence interval; HR, hazard ratio.
