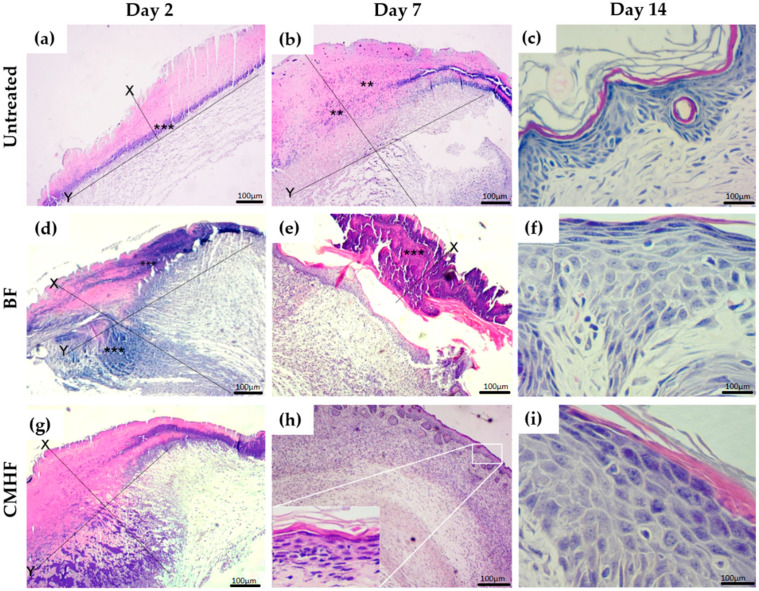
Figure 8.
Hematoxylin-eosin (H&E) staining photomicrographs of biopsies of the untreated, BF and CMHF groups assessed at (a,d,g) day 2, (b,e,h) day 7, and (c,f,i) day 14. The x axis indicates lesion depth extending from the epidermis to the dermis and the y axis indicates lesion extension. Statistical difference demonstrated by ANOVA analysis with p < 0.05 followed by Bonferroni post-test (n = 6).

