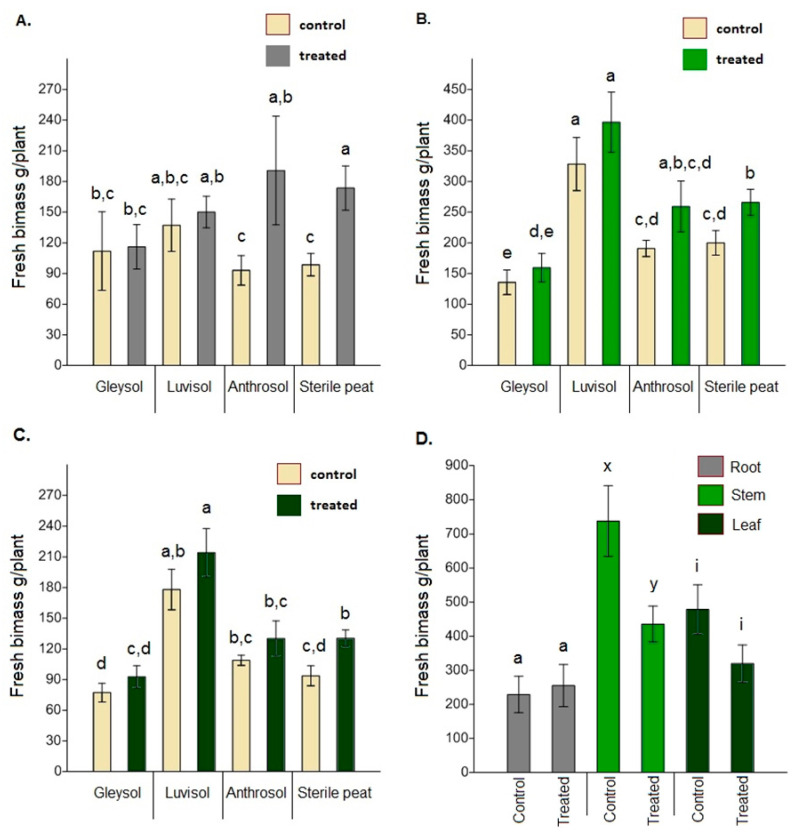
Figure 4.
The fresh biomass of Artemisia annua vegetative organs under different growing conditions (A) root biomass, (B) stem biomass, (C) leaf biomass. Altogether 15 plants were selected randomly from each treatment and substrate type (60 AMF treated and 60 control no-AMF plants). One-way ANOVA followed by Tukey’s test were computed to compare variables (mean ± standard error). Fresh biomass of roots, stems and leaves under open field conditions (D). Altogether 20 randomly selected plants/blocks were collected and the same measurements were made using the same methods. F and t-tests were used to compare variables (mean ± standard error). The different letters above the bar charts indicates statistically significant differences at p < 0.05 level. Dry biomass data showed the same trend.

