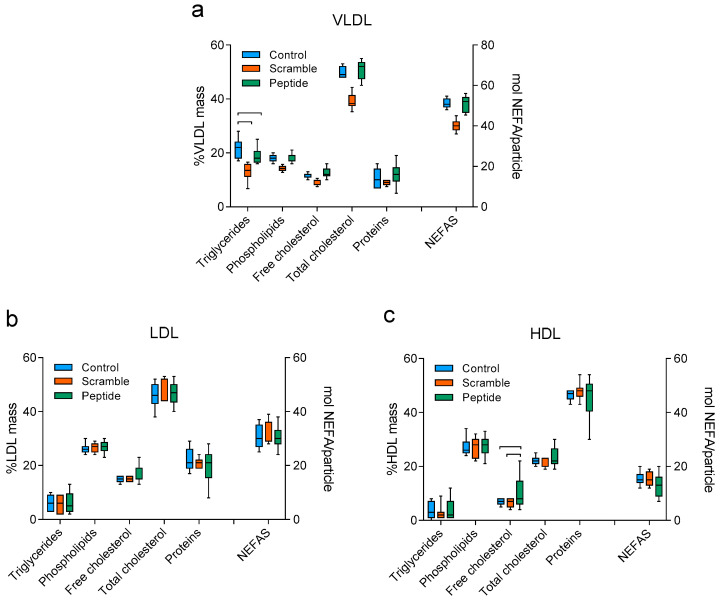
Figure 3.
Lipoprotein composition. (a) VLDL, (b) LDL, (c) HDL. Each graph shows the relative mass of each major component (triglycerides, phospholipids, free cholesterol, total cholesterol, and proteins) and the amount in moles per lipoprotein particle of the non-esterified fatty acids (NEFAS). Data are shown as box-plot graphs, n = 8 (controls and scramble), n = 12 (peptide). Bars indicate p < 0.05 vs. other groups.

