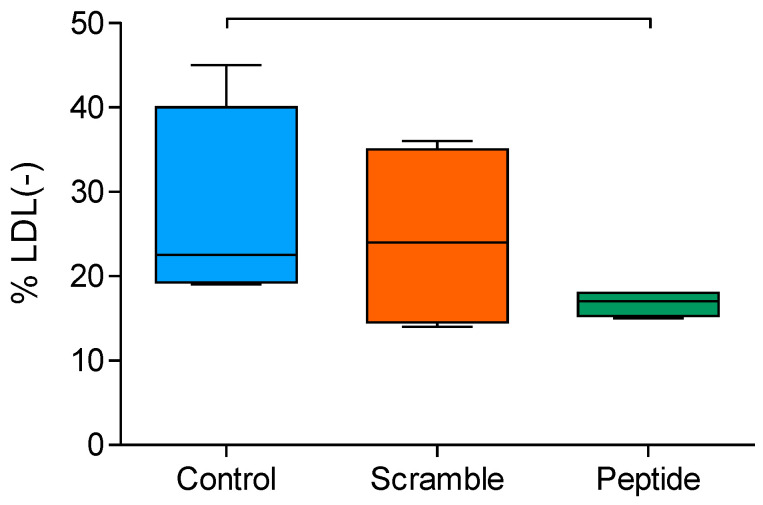
Figure 6.
Electric charge of LDL. LDL dialyzed in buffer A was chromatographed in a MonoQ anion-exchange column, as described in the Methods. Data are expressed as the proportion of the electronegative LDL fraction. Data are shown as box-plot graphs, n = 4 in each group. Bars indicate p < 0.05 vs. other groups.

