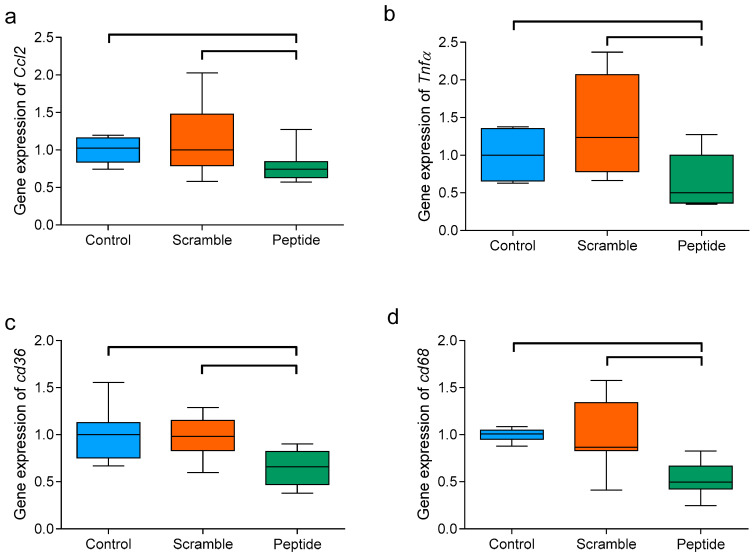
Figure 8.
Hepatic expression of inflammation-related genes. (a) Ccl2, (b) Tnfα, (c) Cd36, and (d) Cd68. Total liver RNA was obtained as described in the Methods, and the expression of target genes was analyzed by RT-PCR. Data are expressed as shown in the box-plot graphs, n = 6 in each group. Bars indicate p < 0.05 vs. other groups.

