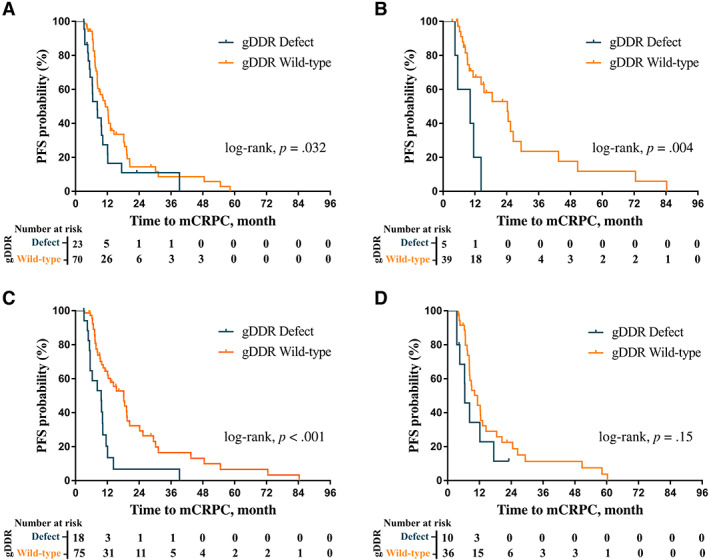
Figure 3.

Kaplan‐Meier plots of time to mCRPC in patient subgroups. (A): Kaplan‐Meier plot of time to mCRPC from initial treatment in high‐volume disease patient subgroup by gDDR gene mutation (gDDRm). (B): Kaplan‐Meier plot of time to mCRPC from initial treatment in low‐volume disease patient subgroup by gDDRm. (C): Kaplan‐Meier plot of time to mCRPC from initial treatment in patient subgroup with prostate‐specific antigen nadir ≤4 ng/mL by gDDRm. (D): Kaplan‐Meier plot of time to mCRPC from initial treatment in patient subgroup with PSA nadir >4 ng/mL by gDDRmAbbreviations: gDDR, germline DNA damage repair; mCRPC, metastatic and castration resistance prostate cancer; PFS, progression‐free survival.
