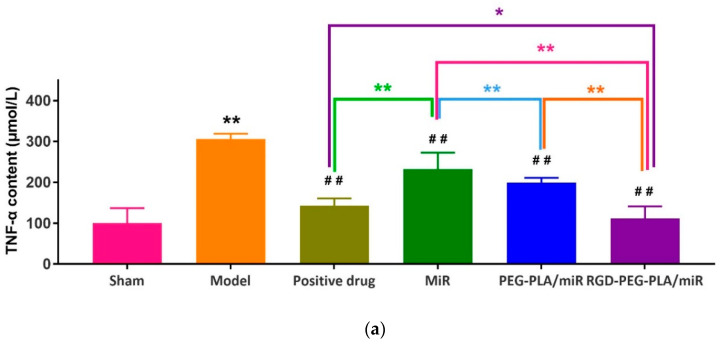
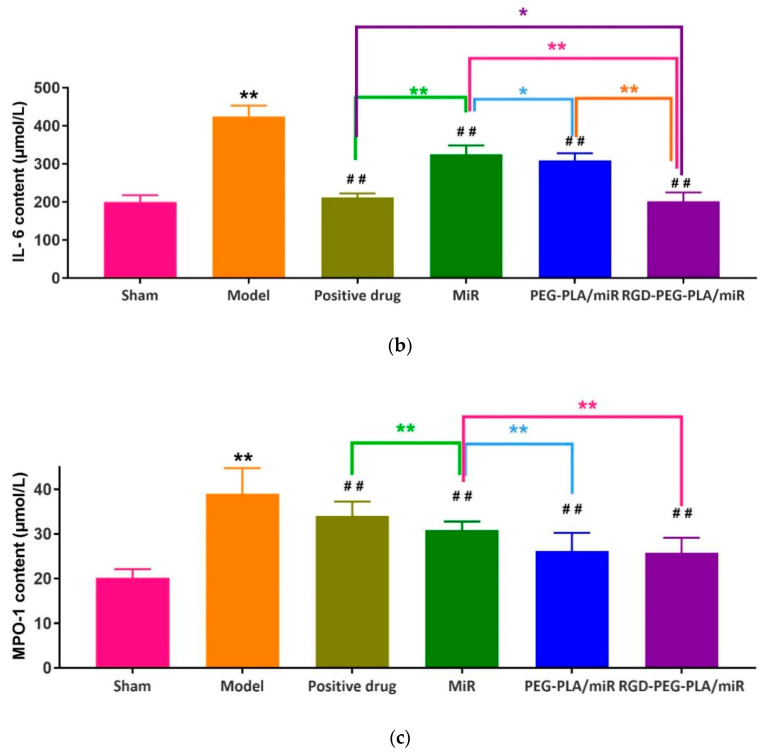
Figure 9.
The contents of (a) tumor necrosis factor-α (TNF-α), (b) interleukin-6 (IL-6), and (c) myeloperoxidase-1 (MPO-1) in six groups of rats (mean ± SD, n = 6). Compared with the sham group, the difference was statistically significant (** p < 0.01). Compared with the model group, the difference was statistically significant (## p < 0.01). The color asterisks indicate significant differences between the two groups, * p < 0.05 and ** p < 0.01.


