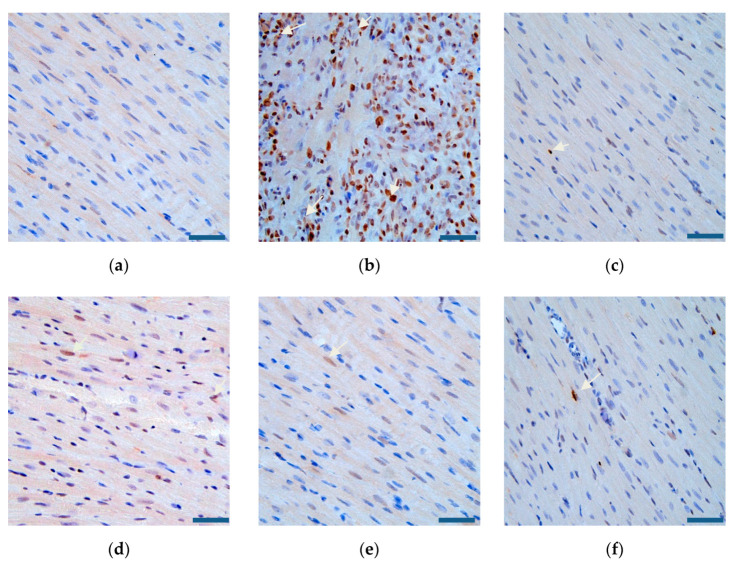
Figure 13.
Cardiomyocyte apoptosis of rats (×400, scale bar = 200 µm) in (a) the sham group, (b) the model group, (c) the positive drug group, (d) the miR-133 group, (e) the PEG-PLA/miR-133 group, and (f) the RGD-PEG-PLA/miR-133 group. Blue: the nucleus of normal cells, brown: the nucleus of apoptotic cells. White arrows indicate the nucleus of apoptotic cells.

