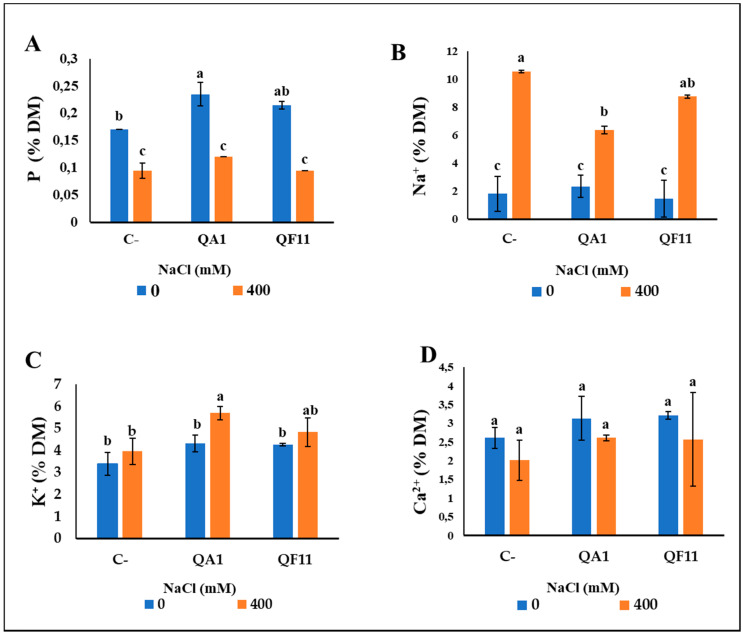
Figure 8.
Effect of salt stress induced by NaCl and bacterial inoculation on the uptake of phosphorus (P) and salt ions by quinoa plants. (A) P (B) Na+ (C) K+ (D) Ca2+. The values represent means of replicates (n = 4) ± standard deviations. The different letters in superscript (a, b, c…) indicate the statistically significant difference at 95% between treatments.

