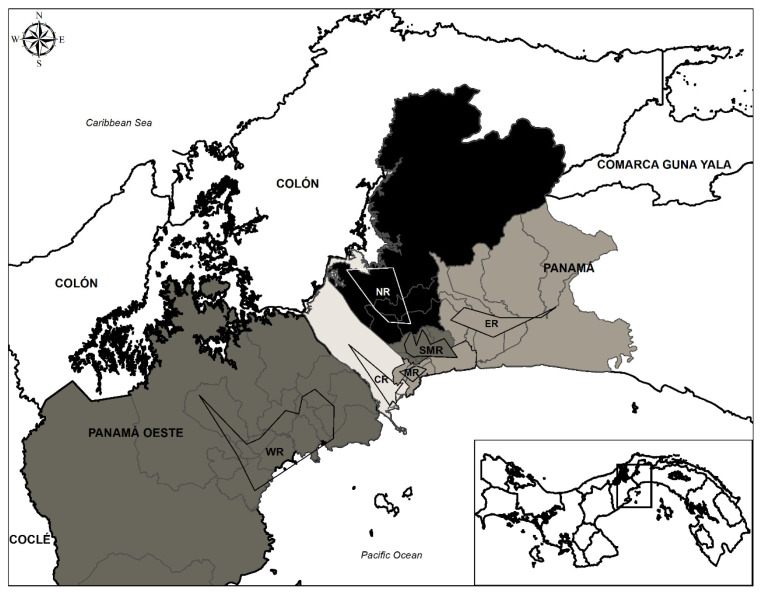
Figure 1.
Map of Panama and West Panama. The areas of sampled regions are delimited using polygons. Sampled regions are coded as follows: NR = North region, WR = West region, SMR = San Miguelito region, ER = East region, MR = Metro region and CR = Central region. Regions are colored in a gray scale according to their T. gondii infection percentages and mean ± standard deviation infection percentage ranges as follows: NR (27.94–31.62); WR, SMR (24.26–27.94); ER (20.58–24.26); and CR (16.89–20.57).

