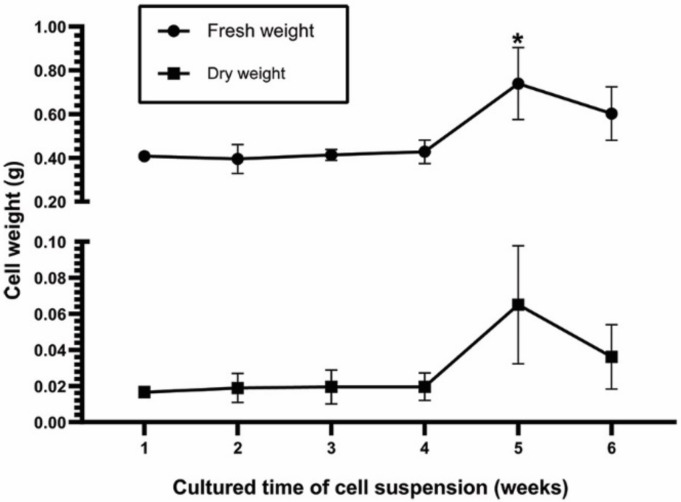
Figure 2.
Profile of growth according to fresh and dry weight (g in 30 mL) of TC cell suspensions at the indicated cultured times (week). Data are presented as the mean ± standard deviation from three cell lines. The asterisk indicates significance (* p-value < 0.05 by t-test from Microsoft Excel 2016).

