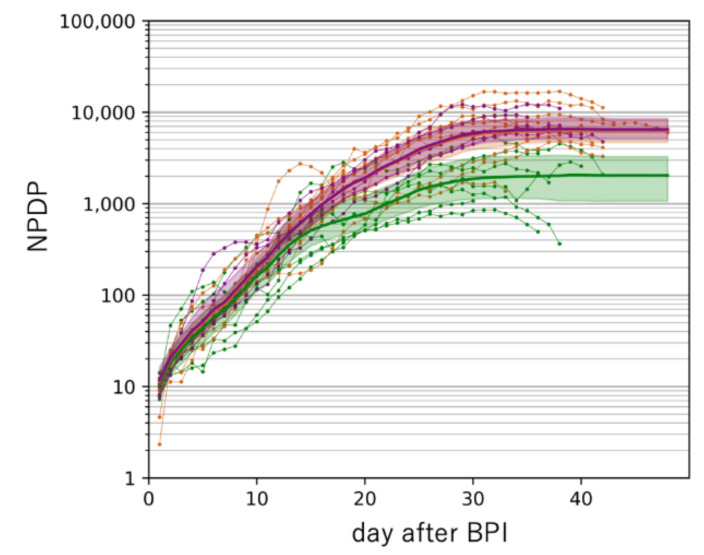
Figure 4.
Estimation of the time course of NPDP after BPI in Western countries by machine learning analysis classified by the positive rate of the PCR test. Green, orange, and purple lines indicate positive rates of 0.0–6.9%, 7.0–16.9%, and 17.0–28.0%, respectively. Each colored area represents a 5–95% confidence interval of the median estimated by bootstrap analysis. The orange and purple lines and areas completely overlapped. NPDP: number of population-adjusted daily test-positive cases. BPI: beginning of the test-positive cases increase. PCR: Polymerase chain reaction.

