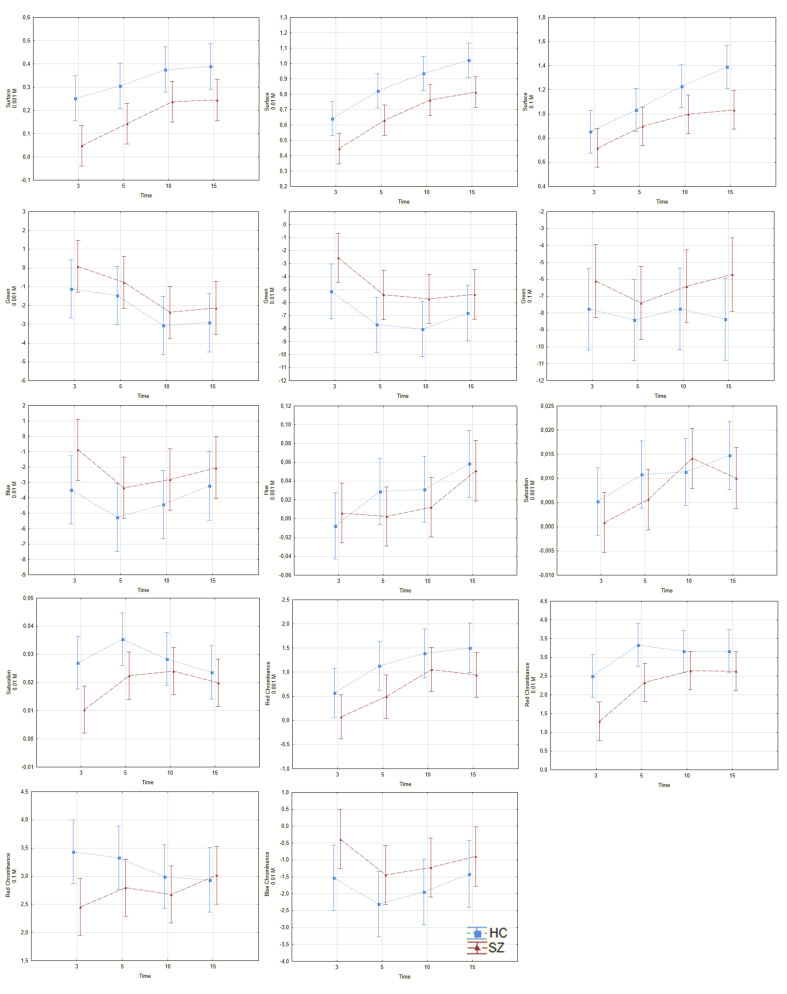
Figure 2.
Differences in responses to niacin solution between HC and SZ. The red line—SZ group, the blue line—HC group, the vertical axis—skin color, the horizontal axis—time of measurement in minutes. Diagrams represent group and within-subjects effects described in the Section 3.1.1. SZ—schizophrenia; HC—healthy control. (a) surface, 0.001 M; (b) surface, 0.01 M; (c) surface, 0.1 M; (d) green colour, 0.001 M; (e) green colour, 0.01 M; (f) green colour, 0.1 M; (g) blue colour, 0.01 M; (h) hue, 0.001 M; (i) saturation, 0.001 M; (j) saturation, 0.01 M; (k) red chrominance, 0.001 M; (l) red chrominance, 0.01 M; (m) red chrominance, 0.1 M; (n) blue chrominance, 0.01 M.

