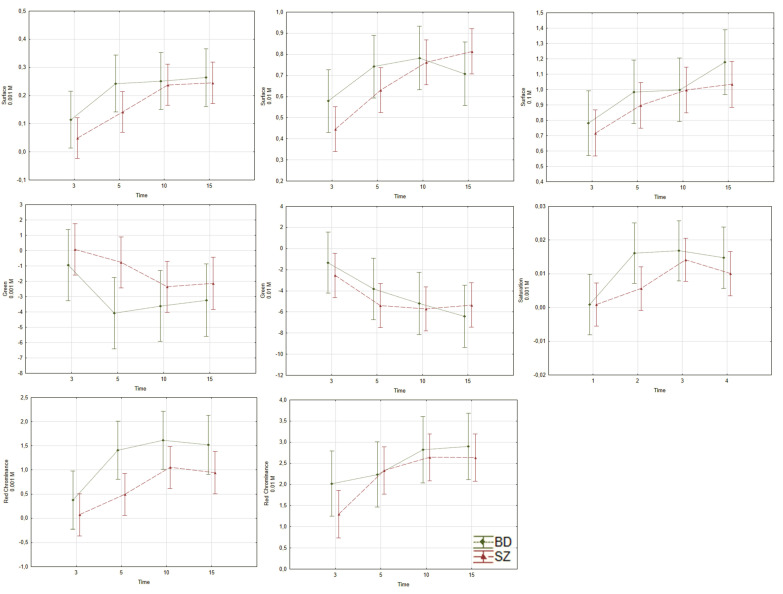
Figure 3.
Differences in response to niacin solution between SZ and BD. The red line—SZ group, the green line—BD group, the vertical axis—skin color, the horizontal axis—time of measurement in minutes. Diagrams represent group and within-subjects effects described in Section 3.1.2. SZ—schizophrenia; BD—bipolar disorder. (a) surface, 0.001 M; (b) surface, 0.01 M; (c) surface, 0.1 M; (d) green colour, 0.001 M; (e) green colour, 0.01 M; (f) saturation, 0.001 M; (g) red chrominance, (h) 0.001 M; red chrominance, 0.01 M.

