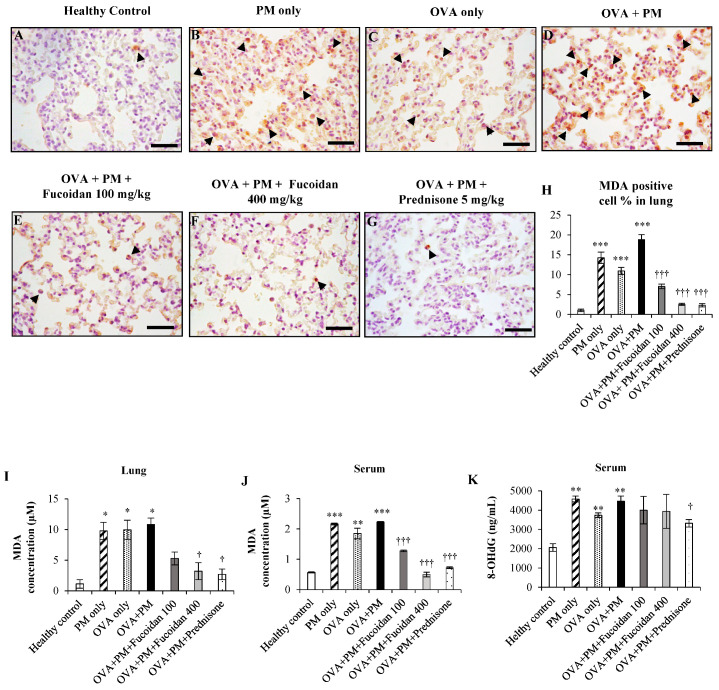
Figure 1.
The effect of fucoidans on the levels of MDA and 8-OHdG in the lungs and serum. The lung (A–G) MDA positive cells, (H) percentages of MDA positive cells and (I) the MDA level are presented. Serum (J) MDA and (K) 8-OHdG levels are presented. Values are expressed as means ± SEM (n = 3). * (p < 0.05), ** (p < 0.05), *** (p < 0.05) represent significant increases compared with the healthy control, and † (p < 0.05) ††† (p < 0.0005) represent significant decreases compared with the OVA + PM group.

