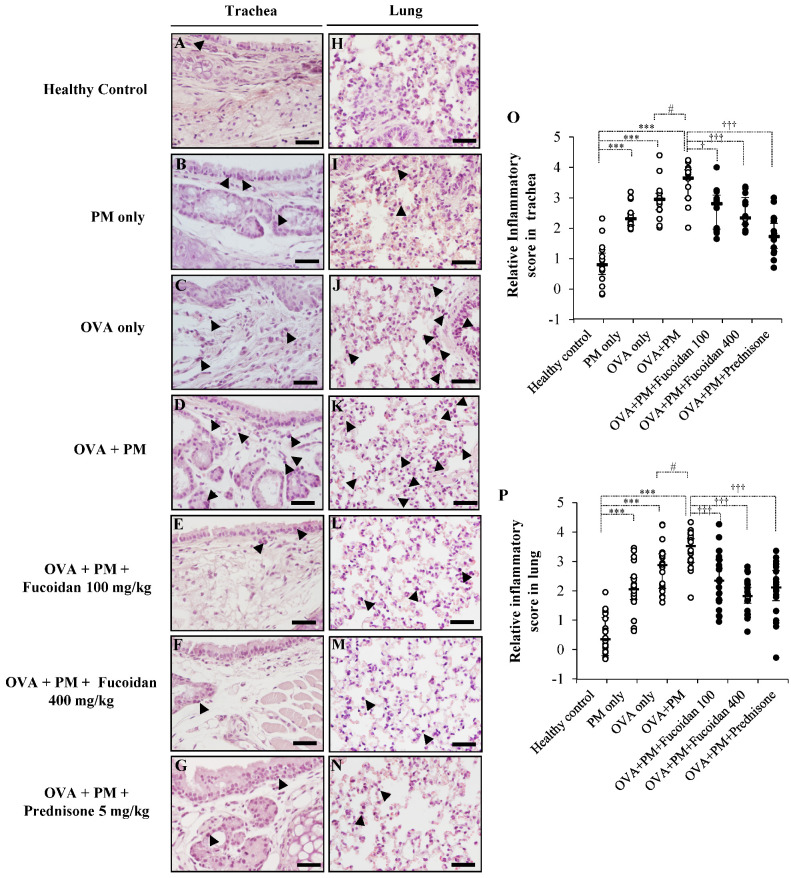
Figure 3.
PM-aggravated histological changes in vivo and the effect of fucoidans on them. Representative images of H&E stained (A–G) trachea and (H–N) lung sections are shown. (A,H) Healthy control, (B,I) PM only, (C,J) OVA only, (D,K) OVA + PM, (E,L) OVA + PM + Fucoidans (100 mg/Kg), (F,M) OVA + PM+ Fucoidans (400 mg/Kg), (G,N) OVA + PM + Prednisone (5 mg/Kg). The infiltration of inflammatory cells is indicated with arrowheads. Scatter plots showing the median and interquartile range of the inflammatory scores for tracheal sections (A–G) are shown in (O) and those for lung sections (H–N) are shown in (P). The degree of peri-bronchial and perivascular inflammation of lung and tracheal sections (at least 6 sections/mice, n = 4) from each group were separately evaluated on a subjective scale as follows: 0, normal; 1, few inflammatory cells infiltrated; 2, infiltration of inflammatory cells one cell layer deep; 3, infiltration of inflammatory cells 2–4 cell layers deep; and 4, a ring of inflammatory cells more than four cell layers deep. The scale bar of (A–N) is 25 µm). We added random jitter in the vertical direction to avoid overlapping data points. The error bars represent the interquartile range and median. *** (p < 0.0005) represents a significant increase compared with the healthy control, and † (p < 0.05), ††† (p < 0.0005) represents a significant decrease compared with the OVA + PM group. # represents a significant increase compared to OVA only.

