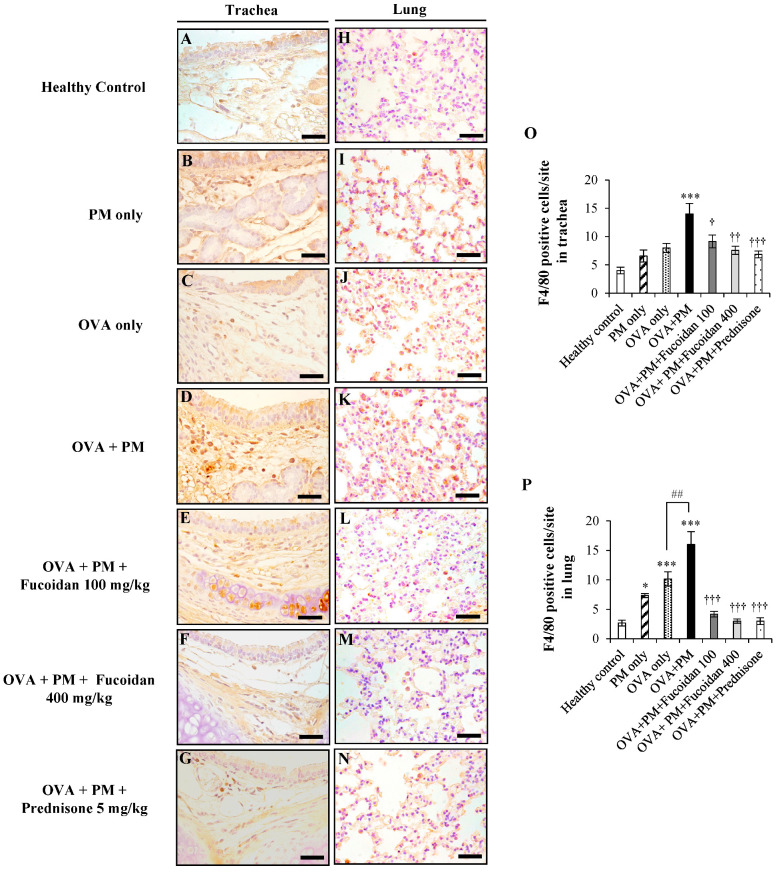
Figure 6.
Immunohistochemical analysis of F4/80+ macrophage cells in the trachea (A–G) and lungs (H–N). (A,H) Healthy control, (B,I) PM only, (C,J) OVA only, (D,K) OVA + PM, (E,L) OVA + PM + Fucoidan (100 mg/Kg), (F,M) OVA + PM + Fucoidan (400 mg/Kg), (G,N) OVA + PM + Prednisone (5 mg/Kg). (O) Number of F4/80+ cells per site in the trachea, (P) Number of F4/80+ cells per site in the lungs. Values are expressed as means ± SEM (n = 3). * (p < 0.05), *** (p < 0.0005) represent significant increases compared with the healthy control, and † (p < 0.05), †† (p < 0.005), ††† (p < 0.0005) denote significant decreases compared with the OVA + PM group. ## denotes a significant increase (p < 0.005) compared with the OVA only group. The scale bar of (A–N) is 25 µm.

