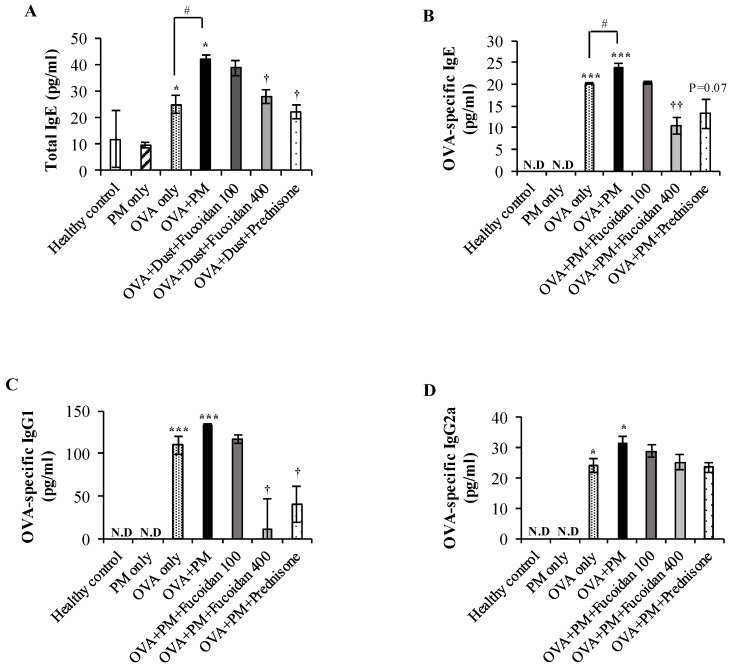
Figure 8.
Effect of fucoidans on immunoglobulin levels in the serum. Levels of (A) total IgE, (B) OVA-specific IgE, (C) OVA-specific IgG1, and (D) OVA-specific IgG2a in serum. Values are expressed as means ± SEM (n = 3). * (p < 0.05), *** (p < 0.0005) represent significant increases compared with the healthy control, and † (p < 0.05), †† (p < 0.005) represent significant decreases compared with the OVA + PM group. # (p < 0.05) represents a significant increase compared with the OVA only group. N.D; not detected.

