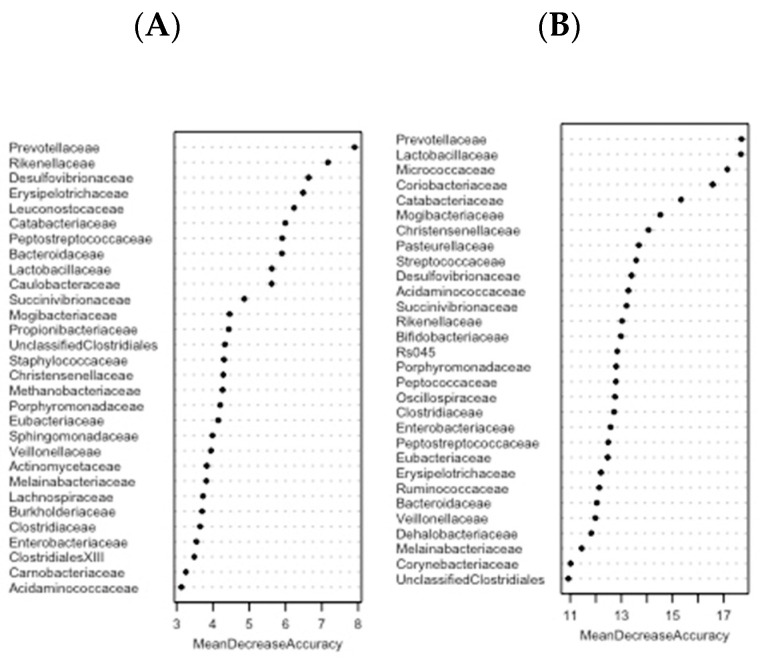
Figure 5.
Ranking of mean decrease in accuracy (MDA) values in random forest analysis, a statistical classification that indicates the importance of each variable. Random forest calculates feature importance by removing each feature from the model and measuring the decrease in accuracy (for presence) or the increase in the mean-square error (for abundance). According to these importance scores, features were ranked in increasing order across models. The plot shows each variable on the y-axis, and their importance on the x-axis. Thus, the most important variables are at the top and an estimate of their importance is given by the position of the dot on the x-axis. (A) The figure shows the hierarchical rank of 30 families listed as responsible for the differences between groups of BMI. (B) The graph shows the hierarchical rank of importance of 30 bacterial families implicated in the differences between groups of GRS.

