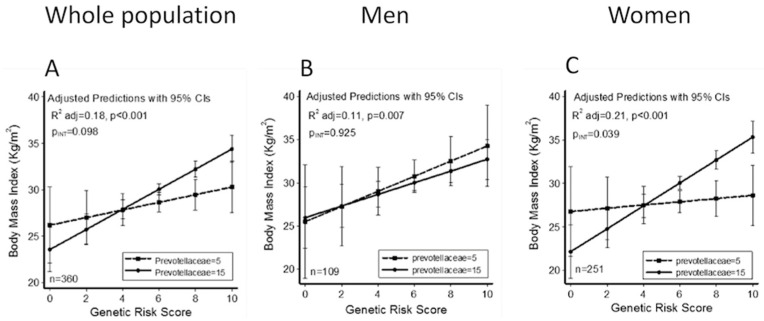
Figure 6.
Predicted values of BMI in all population studied (A), men (B) and women (C) according to the Genetic Risk Score (GRS) calculated with 5 (dash line and square dots) and 15 (solid line and circle dots) relative abundance of Prevotellaceae, using linear regression models adjusted for age, sex, physical activity and energy intake, showing association between relative abundance of Prevotellaceae family and GRS.

