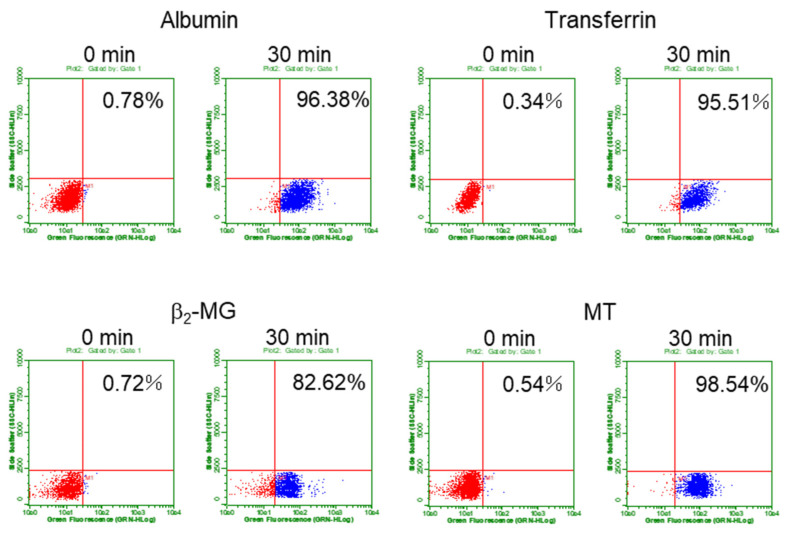
Figure 2.
Evaluation of endocytosis efficiency of the fluorescent-labeled proteins by using flow cytometry. The cells were cultured with each of the fluorescent-labeled protein for 0 or 30 min and applied to flow cytometry. Typical quadrant data of each protein in S1 cells were shown here. X-axis indicates fluorescent intensity and y-axis indicates side scattering. The untreated cells (0 min) showing the auto-fluorescence were gated to be the lower-left section in the quadrants. The cell populations in the lower-right section were expressed as the percentage of total cells and used as the indicator of endocytosis efficiency (%) in the subsequent experiments.

