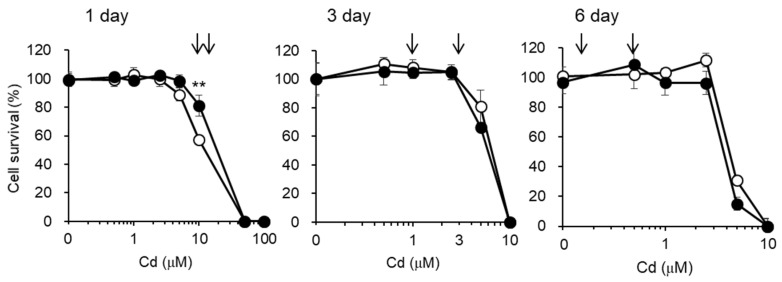
Figure 3.
Cytotoxicity of Cd in S1 and S2 cells. S1 (open circles) and S2 (closed circles) cells cultured in 96-well plates were incubated with the indicated concentrations of CdCl2 for 1, 3, and 6 days. Cell viability was determined by alamarBlue® assay and expressed as a percentage of the nontreated cells. From these results, the Cd concentrations to be used in the subsequent experiments were determined (arrows). Data are presented as means ± SD (n = 4–6). Statistically significant difference between S1 and S2 cells was indicated as ** p < 0.01.

