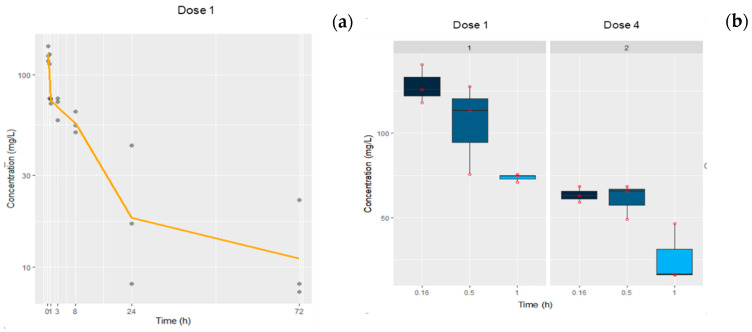
Figure 6.
(a) Time course profile of a-PD-1 plasma concentrations collected from tumor-bearing mice at different time points after receiving the first dose (n = 3/time point). Experimental data are represented by points and the solid line corresponds to the mean (left panel). (b) Box plots represent the plasma concentrations at 10, 30, and 60 min after the first and fourth administrations; symbols show the observed data (right panel).

