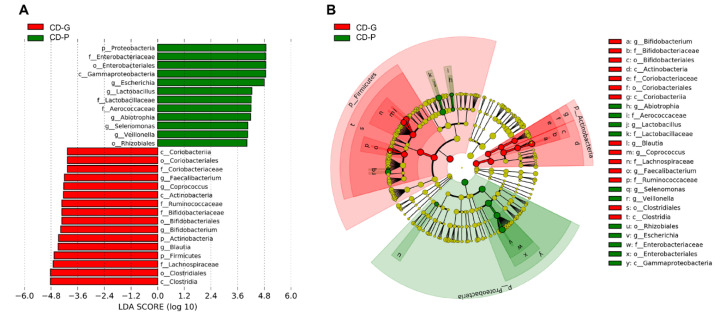
Figure 4.
Differentially abundant bacterial taxa between good prognosis (CD-G) and poor prognosis (CD-P) groups in Crohn’s disease. (A) A forest plot showing the LDA score indicating significant differences in the bacterial taxa between the CD-G (red) and CD-P (green) groups (LDA score >4.0; p < 0.05). (B) Cladogram generated using the LEfSe method, indicating the phylogenetic distribution of microbes associated with the CD-G and CD-P groups. CD-G = good prognosis group; CD-P = poor prognosis group; LDA = linear discriminant analysis.

