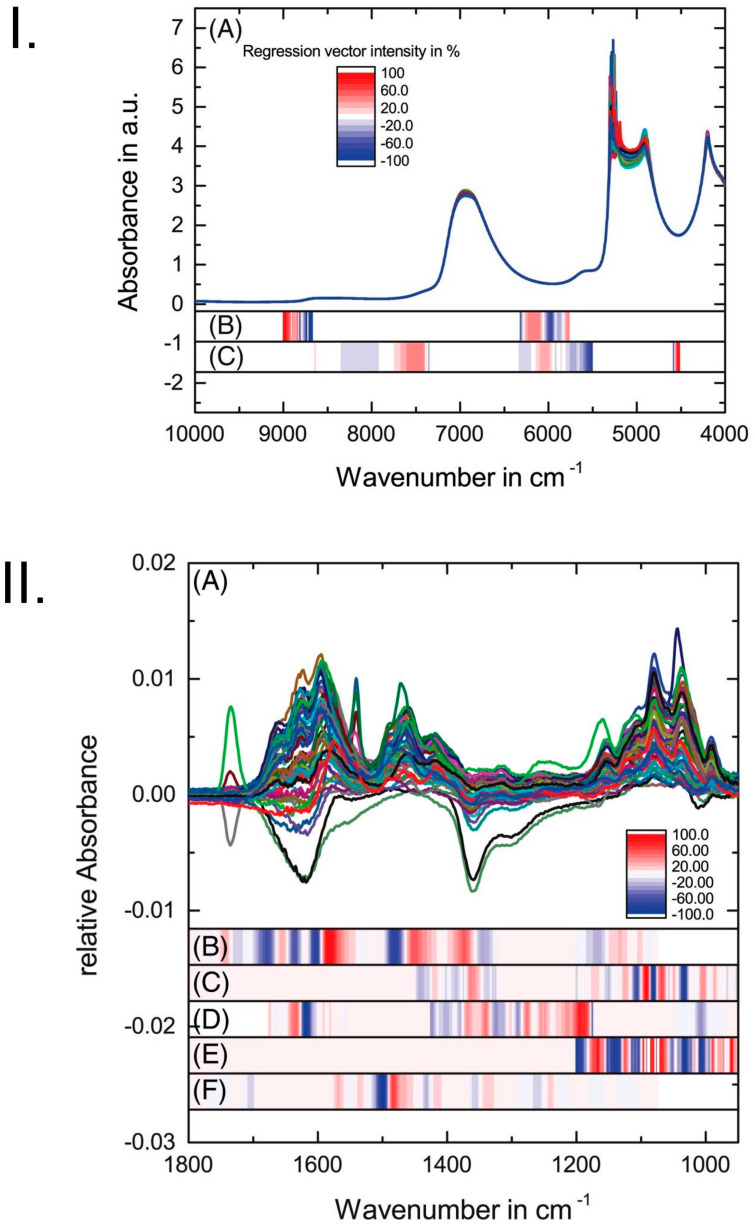
Figure 2.
Dissection of the PLS regression vectors developed by Henn et al. [33] for prediction of blood constituents from NIR absorbance (I.A) and IR difference (II.A) spectra of a 5-component model mixture in artificial dialysate solutions. Relative (to the maximum value) intensity of the regression vector for glucose (B) and urea (C), lactate (D), phosphate (E) and creatinine (F). Adapted in agreement with CC BY 4.0 license, Ref. [35].

