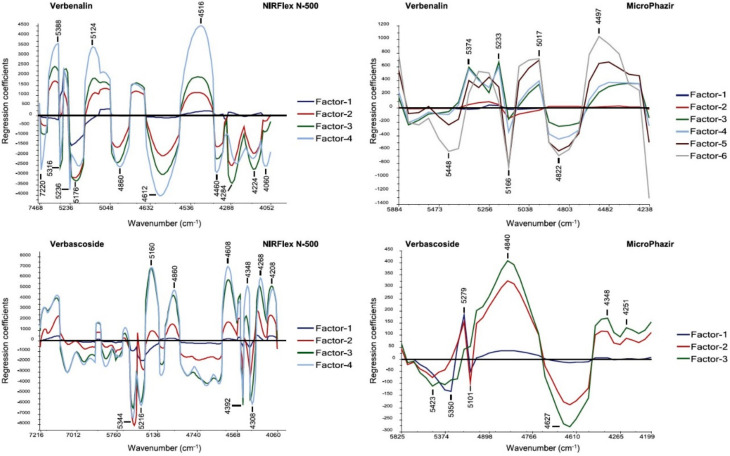
Figure 8.
PLS regression coefficients plots for the best performing calibration models for verbenalin and verbascoside content in Verbena officinalis samples. The models were constructed for NIR spectra measured on NIRFlex N-500 (benchtop) and microPhazir (miniaturized) spectrometers. Reproduced with permission from Elsevier, Ref. [77].

