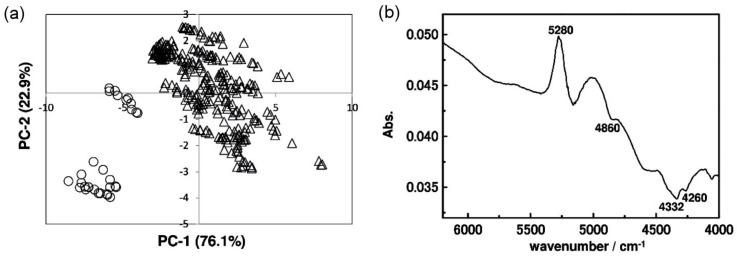
Figure 10.
PCA scores plot of NIR spectra of yolk measured over the development time of Oryzias latipes embryo (a). Δ indicates the data collected from the first to the tenth day and ⚪ denotes data collected at the day before hatching. Loadings plot of PC-1 (b). Reproduced from Ref. [83] in agreement with CC BY 4.0 license.

