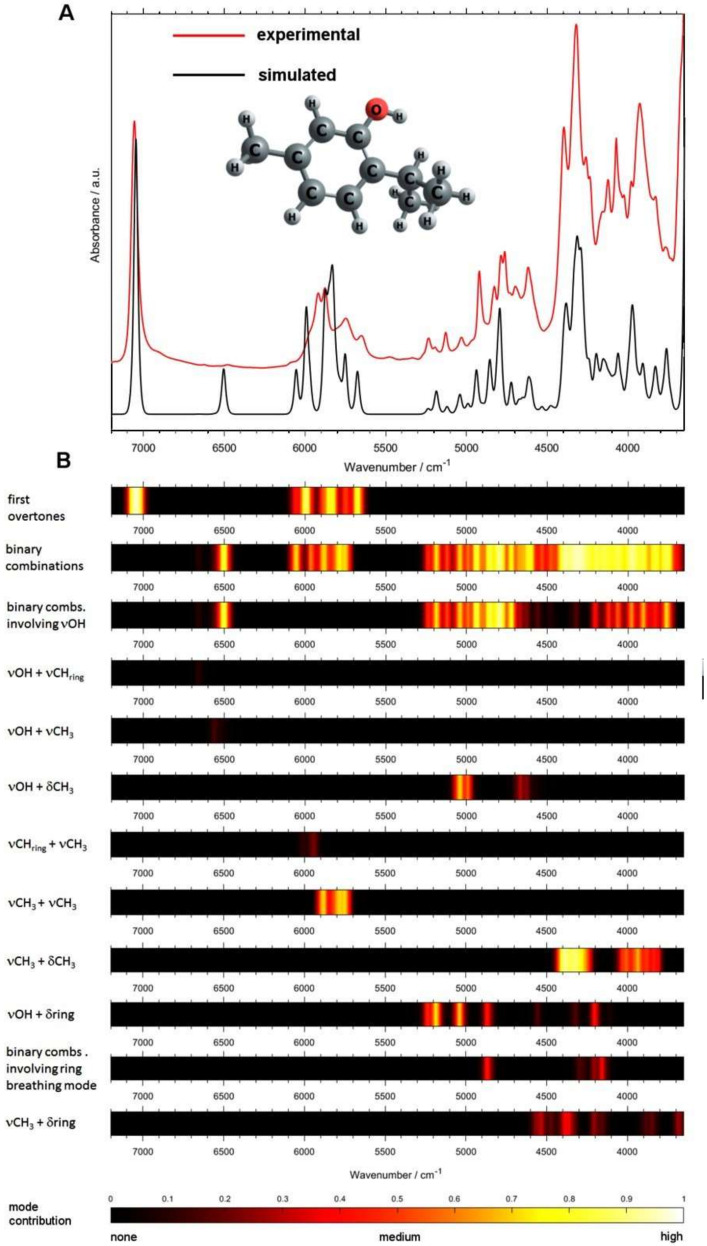
Figure 12.
The analysis of mode contribution for the NIR spectrum of thymol (solution; 100 mg mL−1 CCl4) based on the simulated data. (A) Experimental and simulated outlines. (B) Contributions of selected modes as described on the figure. Reproduced with permission from Ref. [96].

