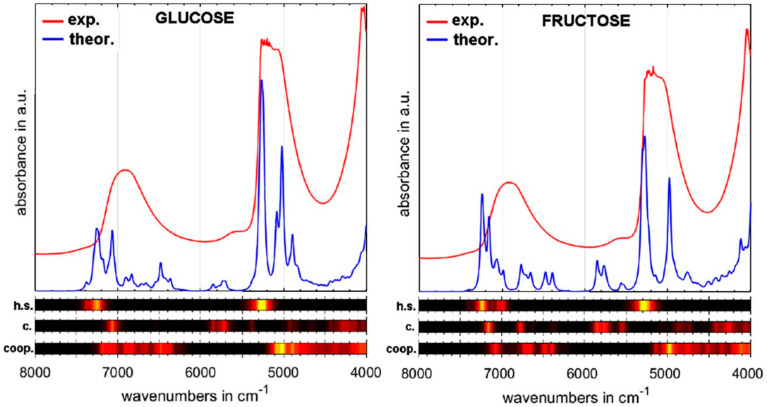
Figure 13.
Simulated spectra of the carbohydrate-hydration shell system on the example of glucose and fructose. The color bars represent the relative spectral contributions (color scale: yellow—high; black—none) from: pure vibrations of hydration shell (h.s.); pure vibrations of carbohydrate (c.); cooperative vibrations of carbohydrate and hydration shell (coop). Reproduced in compliance with CC BY 4.0 license from Ref. [104].

