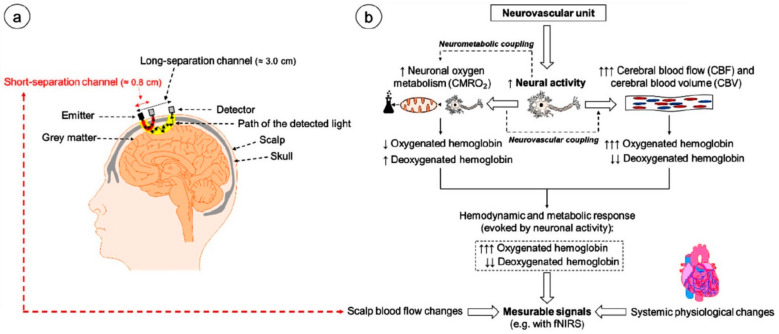
Figure 14.
(a) Schematic illustration of the neurovascular unit and the changes in cerebral hemodynamics and oxygenation induced by neural activity. (b) Exemplary illustration of a possible NIRS montage on the human head and the assumed banana-shaped course of detected light of “short-separation channels” and of “long-separation channels”. fNIRS, functional near-infrared spectroscopy; CMRO2, cerebral metabolic rate of oxygen; increase; decrease. Reproduced in compliance with CC BY 4.0 license from Ref. [113].

