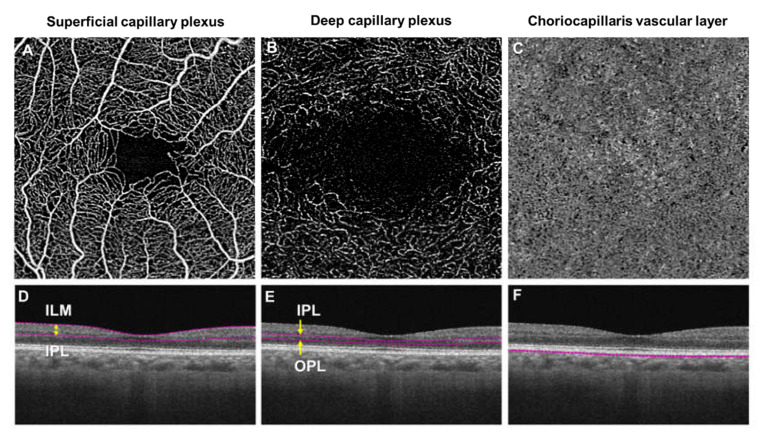
Figure 3.
En-face optical coherence tomography angiography (OCTA; 3 × 3 mm area) images (Top row, A–C) and horizontal B-scan images of their layer-segmentation (Bottom row, D–F) of a healthy control individual. (A) OCT angiogram of a superficial vascular plexus centered on the macula. (B) The OCT angiogram of a deep capillary plexus centered on the macula. (C) An OCT angiogram of a choriocapillaris vascular layer centered on the macular. (D) The en-face image of the superficial plexus was segmented from the internal limiting membrane (ILM) to the inner plexiform layer (IPL). (E) The image of the deep plexus was segmented from the IPL to the outer plexiform layer (OPL). (F) The OCT angiogram of the choriocapillaris layer was segmented within a thin 10 µm thick slab (31–40 µm) below the retinal pigmented epithelium. The foveal avascular zone (FAZ) is visibly larger in the deep plexus (B) than superficial plexus (A). (B,C) were created after removal of projection artifacts.

